Pen Stroke Sequence Feature Extraction from MNIST Digits
I’ll first introduce a dataset to enlighten the motivation behind doing this: Pen Digits Dataset.
Pen Digits Dataset
Pen Digits Dataset contains 10,990 samples of handwritten digits. Each sample consists of 16 features, which represent the sequence of 8 coordinate points sampled along the path of the pen’s trajectory when drawing the digits, and each sample is labelled with the corresponding digit in the range of 0 to 9. The value of each feature is an integer in the range of 0 to 100. Therefore, each of the 8 sample points is a bounded in a 100x100 co-ordinate plane. Figure 1 shows sample digits from the dataset plotted by making a dotted line over the sequence of 8 coordinate points.
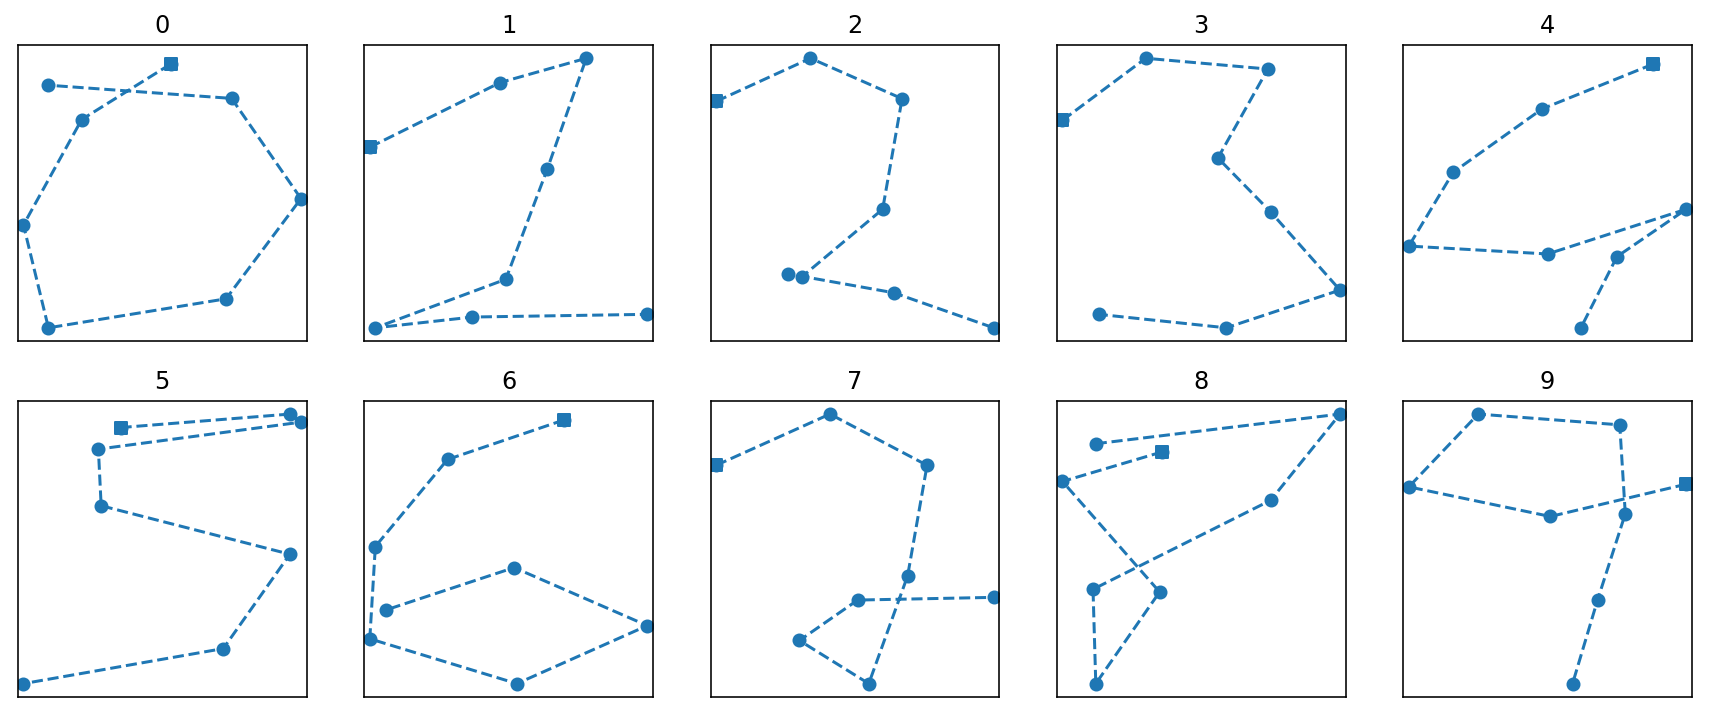 Figure 1. Sample digits from Pen Digits Dataset. Square markers indicate starting point.
Now, I’ll introduce another popular dataset: MNIST Handwritten Digits Dataset
MNIST Handwritten Digits Dataset
MNIST dataset consists of 70,000 grayscale images of handwritten digits. Each image has the resolution of 28x28 pixels. Figure 2 shows sample images for each digit.
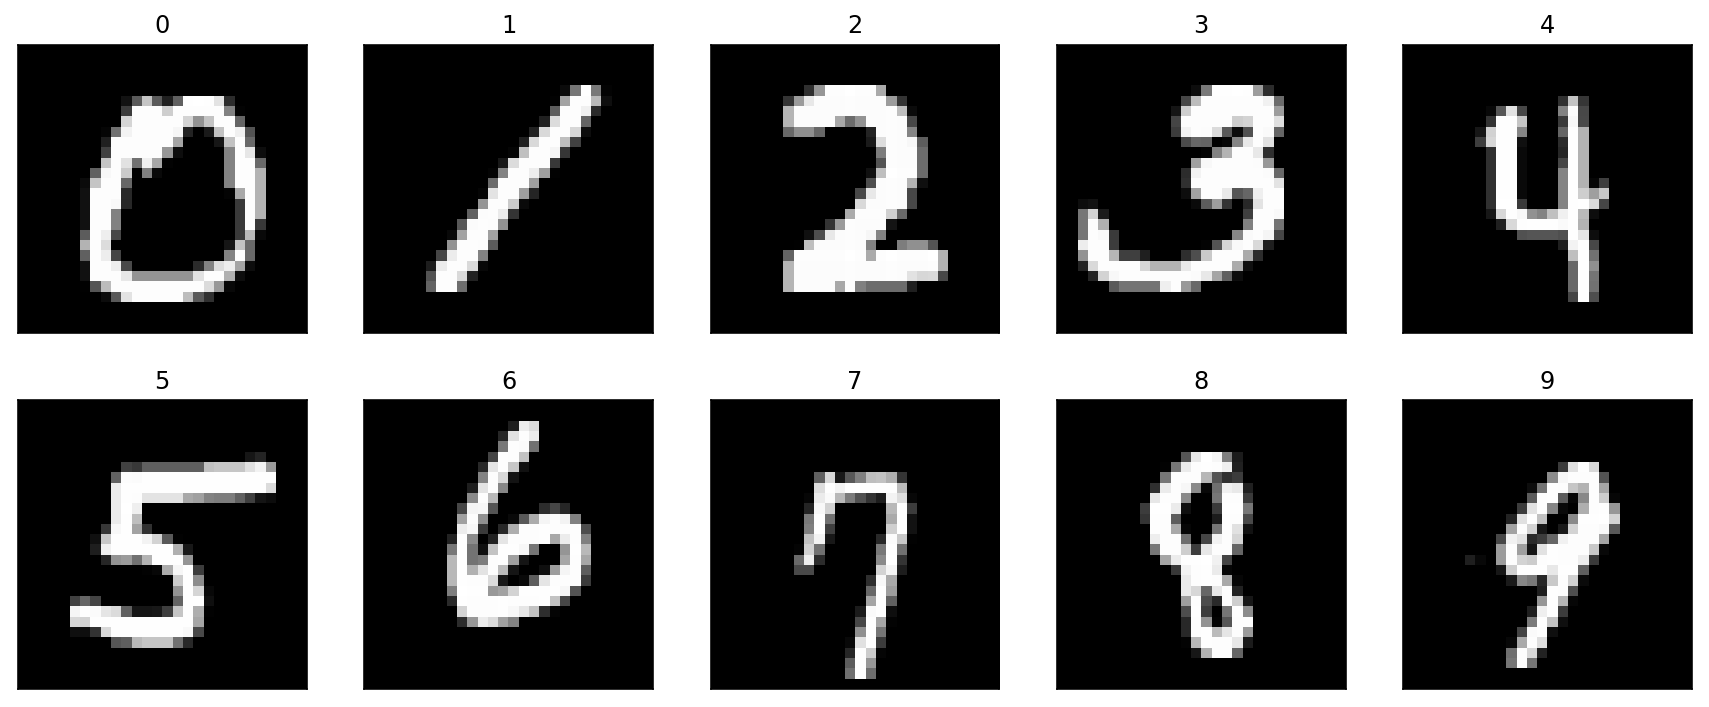 Figure 2. Sample digits from MNIST Dataset
Generally, this dataset is used to make predictions of digit labels given an image of the handwritten digit. But I’ll dive into a different problem here: How to approximate the path of pen from these images? Put simply, how to extract pen digits dataset like features from MNIST images? The problem can be simplified to extracting 8 sequence of sample coordinate points along the path of the digits similar to that in the pen digits dataset. I have broken down the process into a series of steps as follows.
Feature Extraction Process
Pixels to Coordinate Points
Each pixel in a grayscale image is located in a 2D-space. So, I extracted coordinate locations of all pixels whose intensity is above a certain threshold value. This threshold value is set to be different for each of the 10 digit labels, and was determined by trial and error with visual analysis of the average image representation for each digit label such that the threshold value didn’t significantly destroy the structure of the digits. I then transformed the range of coordinates points from [0,28] to [0,100] to match it with the pen digits dataset.
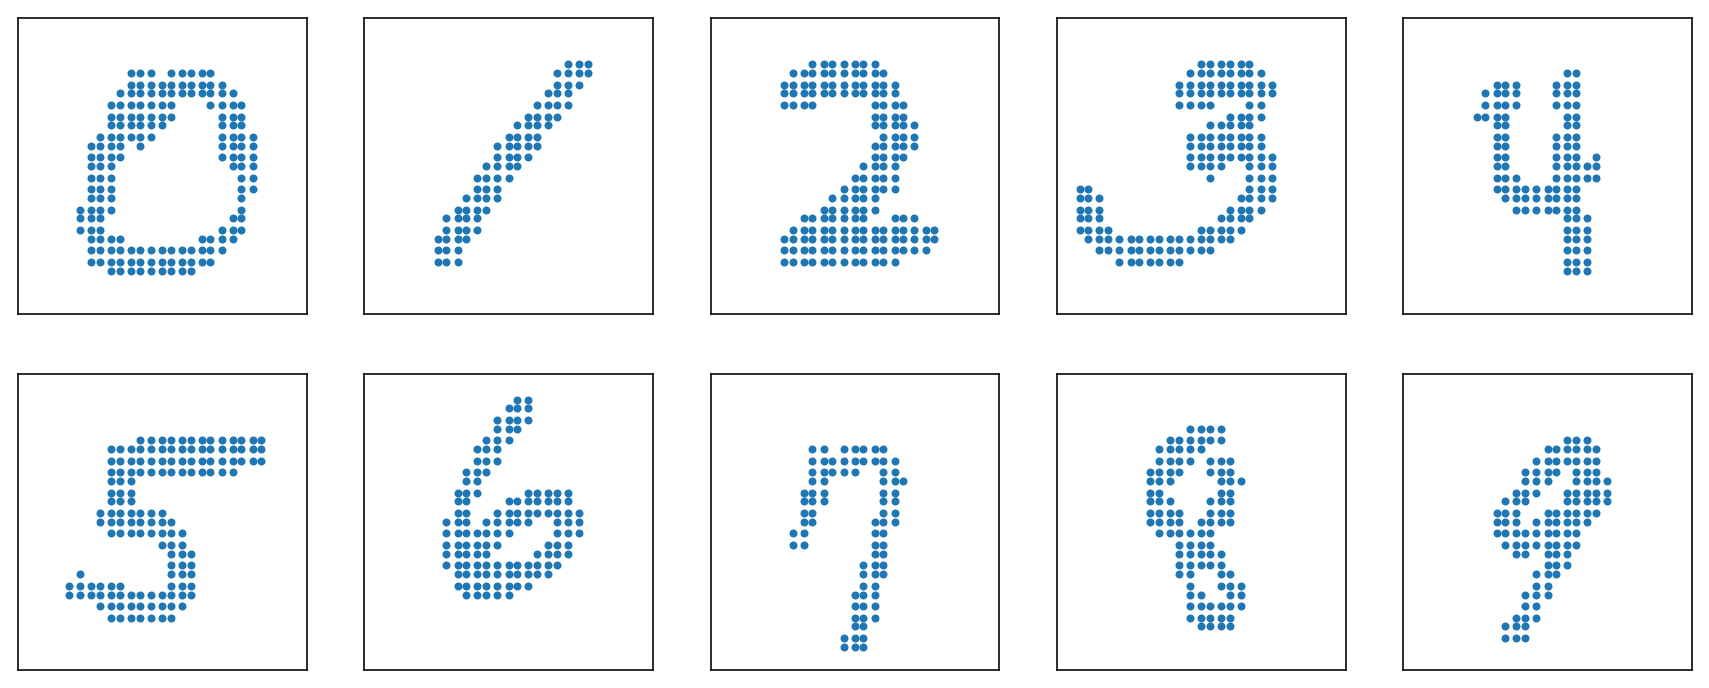 Figure 3. Scatter plot of coordinate points corresponding to pixels
| Digit | 0 | 1 | 2 | 3 | 4 | 5 | 6 | 7 | 8 | 9 |
|---|---|---|---|---|---|---|---|---|---|---|
| Threshold | 70 | 110 | 100 | 110 | 50 | 80 | 100 | 60 | 100 | 70 |
Table 1. Threshold for pixel values above which coordinate points are extracted from pixels
K-Means Clustering
I applied k-means clustering to learn 8 cluster centroids on the extracted coordinate points. These centroids turned out to be a very good approximation of the 8 sample points on the path the digits.
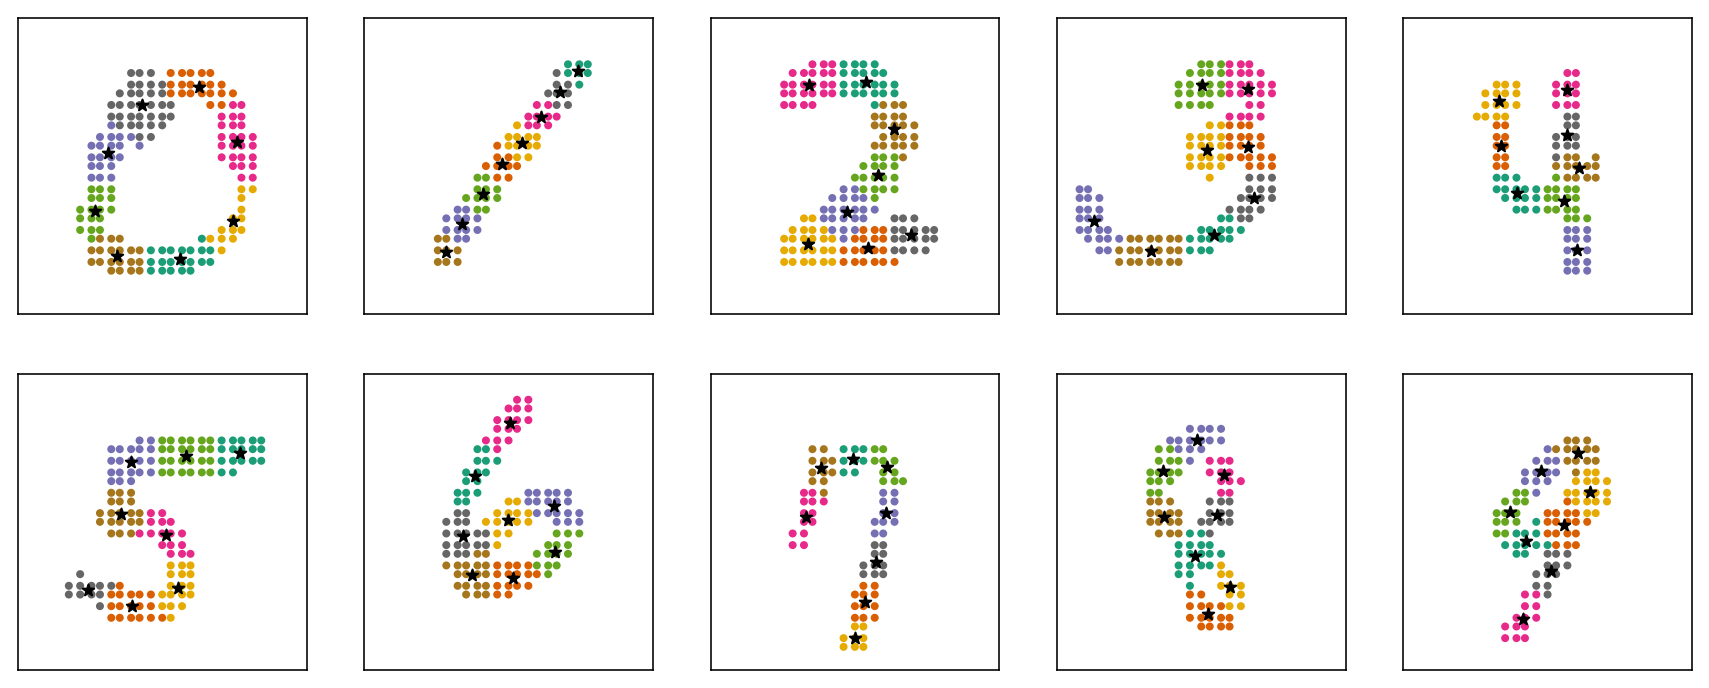 Figure 4. K-Means clustering on the coordinate points
Sequential Ordering of 8 Sample Points
The 8 sample points obtained by k-means clustering could be sequentially ordered in 8! ways (=40320 permutations), but most of the permutations would form random shapes that are completely different from the original digits. Therefore, to find the best sequential order of these sample points, I first manually define ten ‘template’ sequences (one template for each digit label) of 8 sample points obtained by k-means clustering on coordinate features of the average image representation of each of the ten digit labels. Then, for a given 8 sample points of a digit, I minimize the mean squared error (MSE) between the template sequence of that digit label and each permutation of the 8 sample points to obtain the best sequential order.
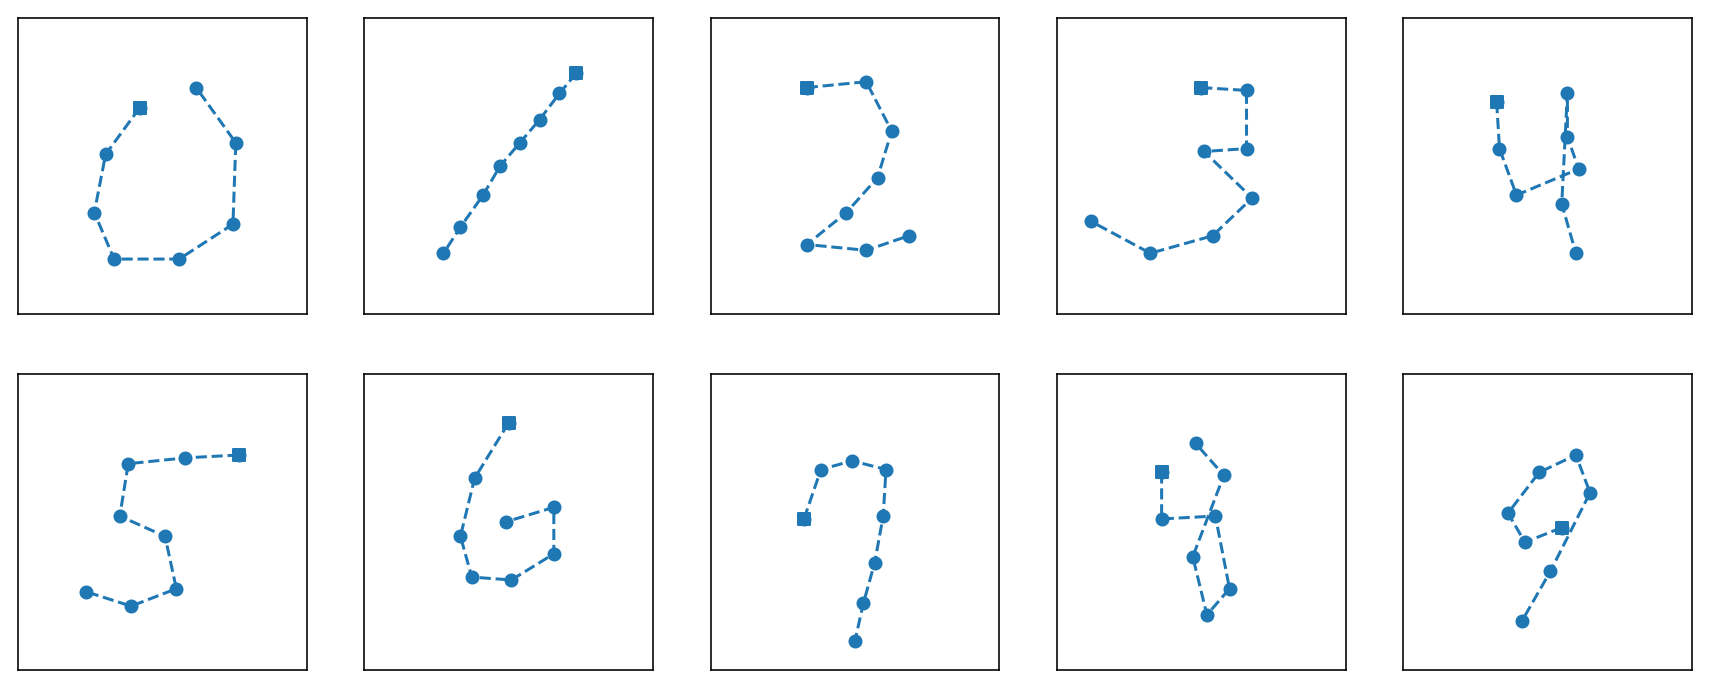 Figure 5. Sequential order of 8 sample points obtained by minimizing MSE with template sequence
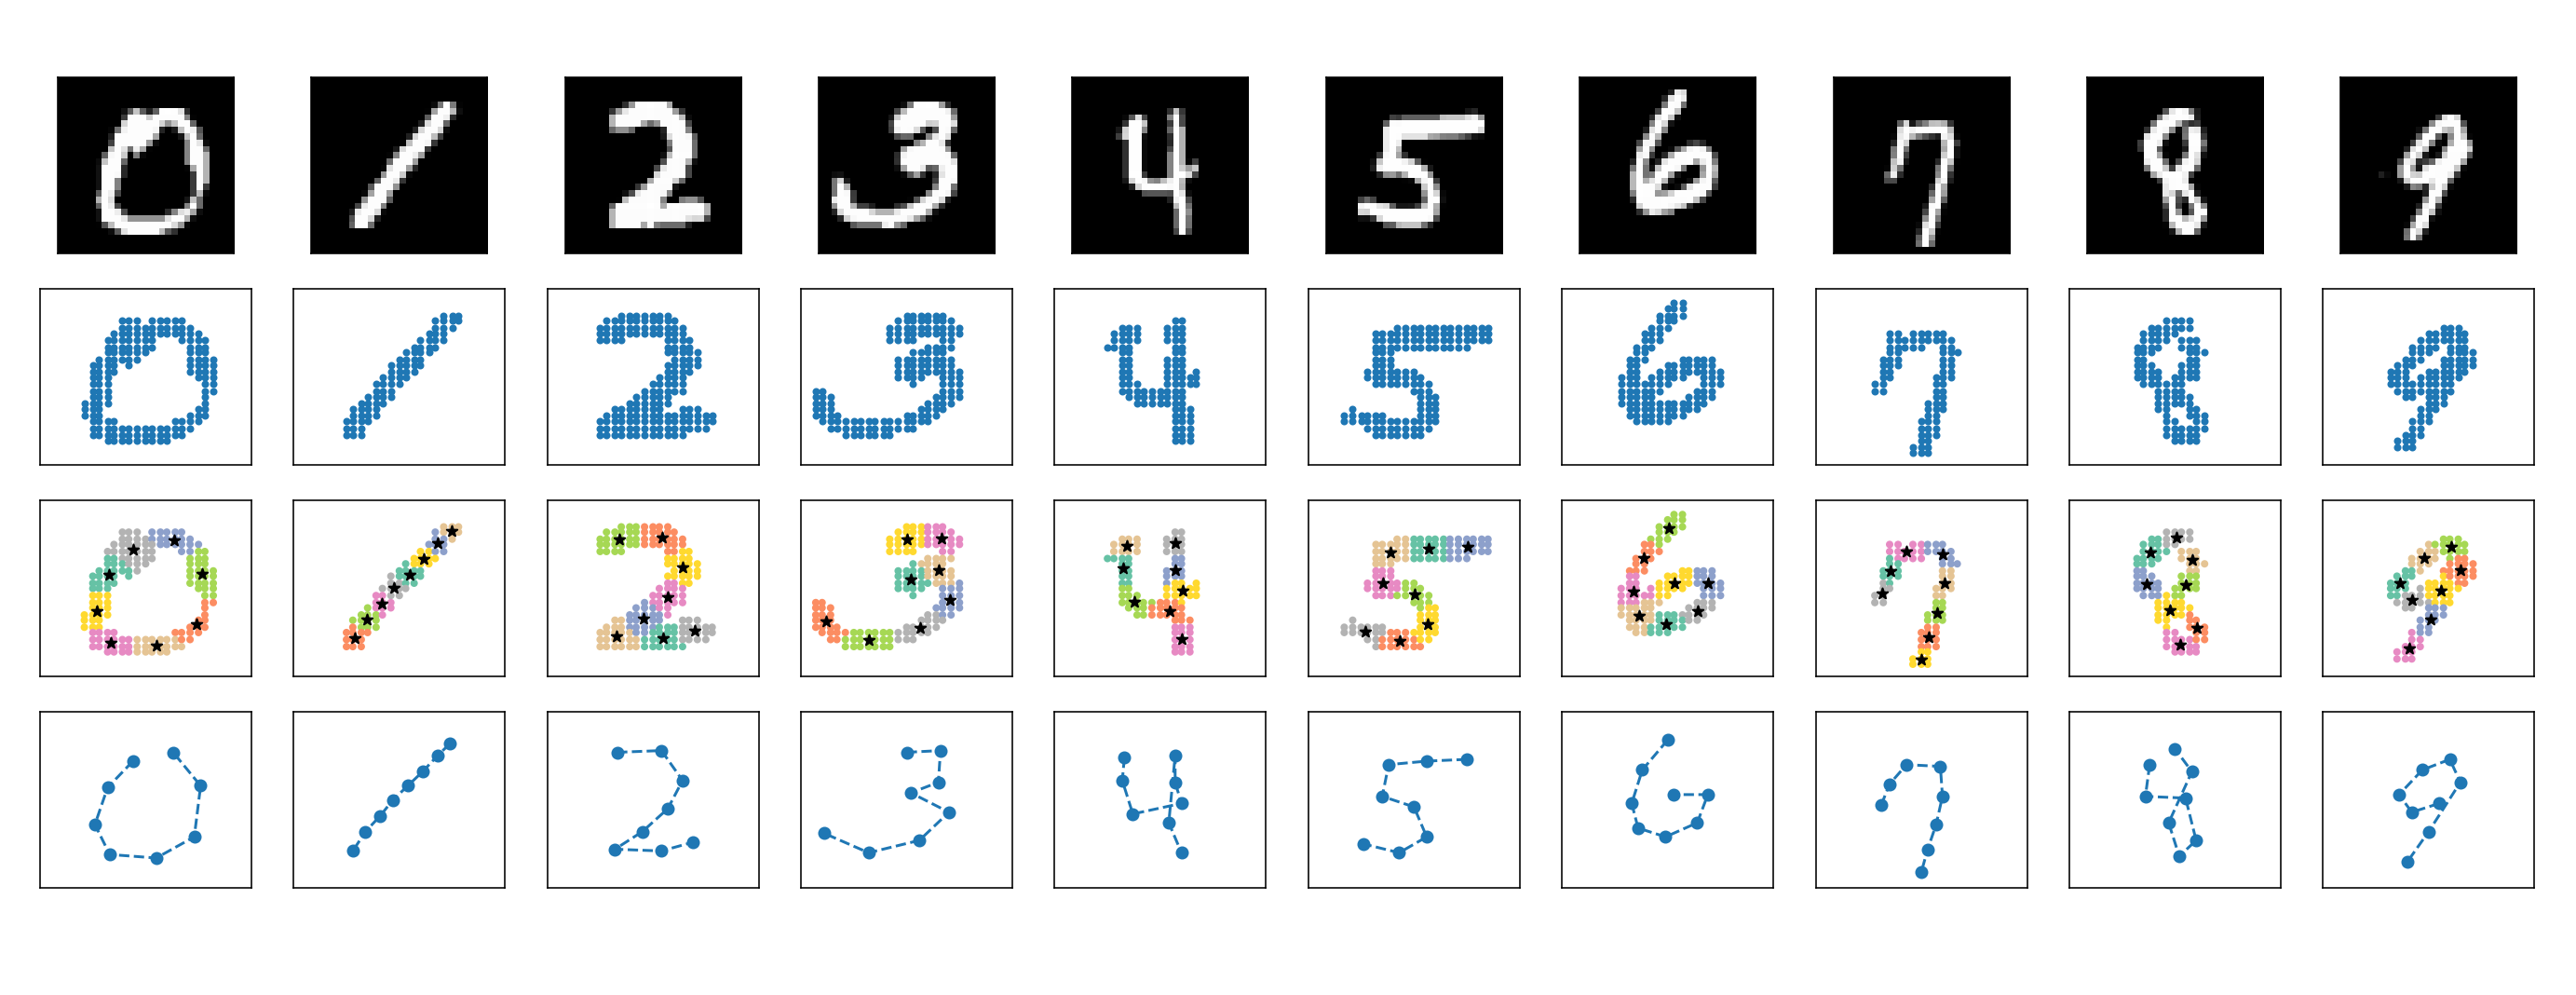
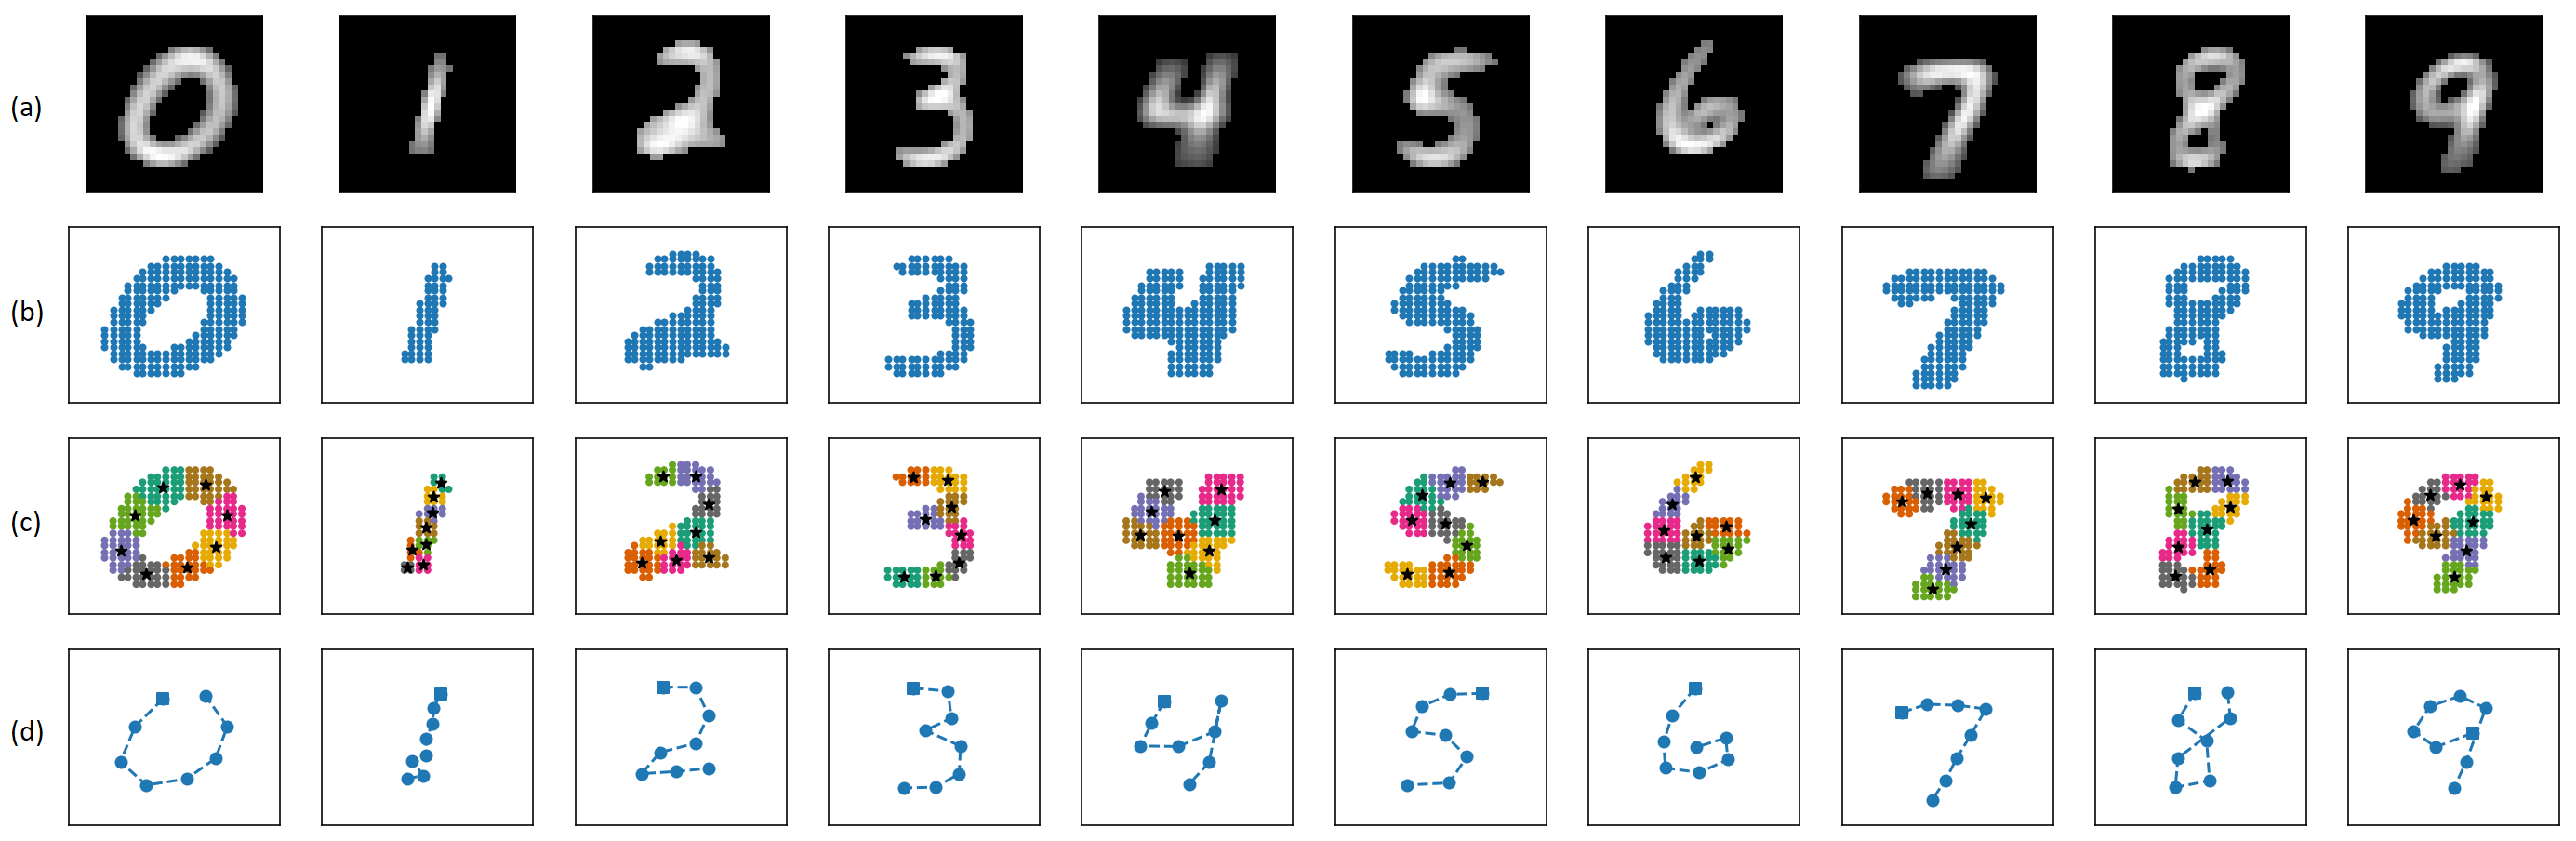 Figure 6. Making template sequence for each digit label: (a) Average image representation of each digit label in MNIST dataset (pixels values lower than certain threshold are darkened) (b) Scatter plot of extracted coordinate points (c) K-Means clustering on the coordinate points (d) Template sequence made by manually ordering the sequence of 8 centroids to form the shape of the digits
Cropping and Scaling
There was still a lot of margin left on all four sides of the thus extracted coordinate features. However, original pen digits dataset has digits exactly or almost touching the boundaries of 100x100 coordinate plane as shown in Figure 1. So, I performed cropping and scaling to make the digits exactly touch the boundary keeping the aspect ratio constant. For this, I first calculated the bounding box coordinates that exactly encloses the 8 sample points. Then, I translated the sample points such that midpoint of the bounding box lies at the origin. After that, I scaled the coordinate features so that larger sides of the bounding box had the length of 100 units. Finally, I translated the coordinate points such that the midpoint of the bounding box was on midpoint of the 100x100 coordinate plane. This resulted in the digits touching the boundary on at least two sides, making them similar to features in the pen digits dataset.
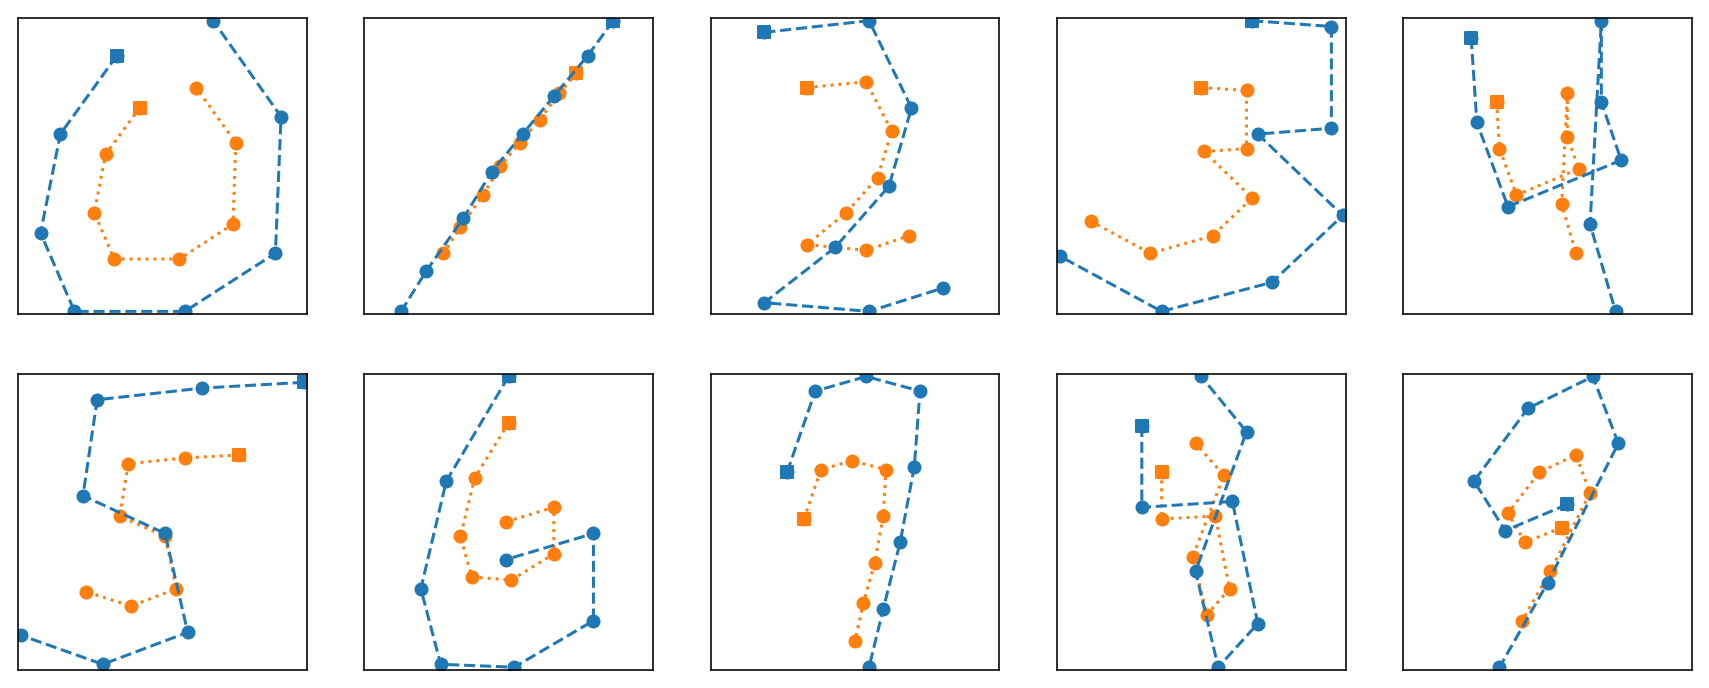 Figure 7. Cropping and Scaling of Coordinate Features
Experimental Results
I wanted to evaluate how good the extracted features from MNIST perform using classifier models trained on pen digits dataset. So, I trained three simple classifiers, k-nearest neighbors, decision tree, and support vector machine on pen digits dataset that achieved the following accuracies.
| KNN | Decision Tree | SVM | |
|---|---|---|---|
| Train Accuracy | 0.9972 | 0.9977 | 0.9913 |
| Test Accuracy | 0.9780 | 0.9159 | 0.9537 |
Table 2. Accuracy on Pen Digits Dataset
Then, for 500 sample digits (50 for each of the ten digit labels sampled randomly), I performed feature extraction as described above, and evaluated them on the classifiers trained on pen digits dataset. The performance on MNIST samples is as follows.
| KNN | Decision Tree | SVM | |
|---|---|---|---|
| Accuracy | 0.836 | 0.622 | 0.800 |
Table 3. Accuracy on MNIST Dataset (500 samples)
Conclusion
I applied a series of steps for feature extraction from MNIST digits: converting pixels to coordinate points, k-means clustering, sequential ordering of sample points, and cropping and scaling. The accuracy of KNN, decision tree and SVM (trained on pen digits dataset) on MNIST dataset was 83.6%, 62.2% and 80% respectively. This is certainly a good performance (especially for KNN and SVM) despite the differences in origin and data capture process of pen digits dataset and MNIST dataset. It also seems to be a testament to the robustness of the unique feature extraction technique.